Home> Image Gallery> Page 2 of 4
|
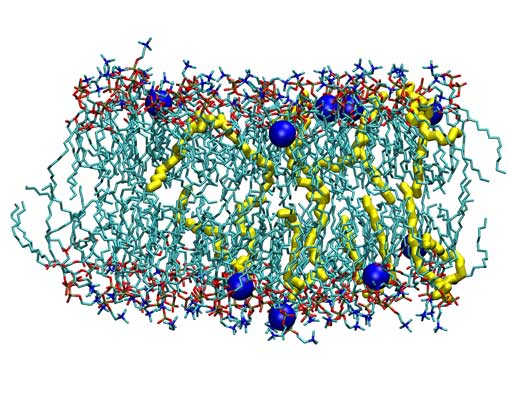
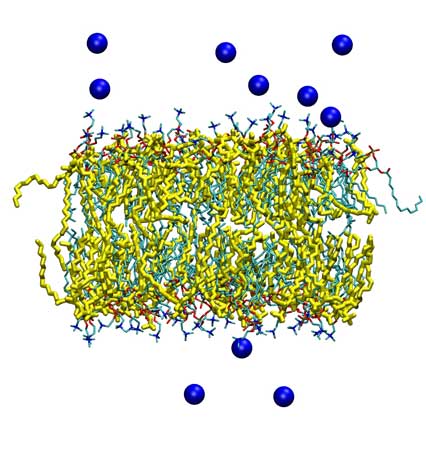
Structure of DMPC/DMTAP bilayers after 70 ns with 0.1 M NaCl. Shown are bilayers with molar fractions of cationic DMTAP lipids equal to 0.06 (top) and 0.50 (bottom). Lipids shown are DMPC (cyan) and DMTAP (yellow). Sodium ions are shown as blue spheres. Water is not shown. (bottom). |
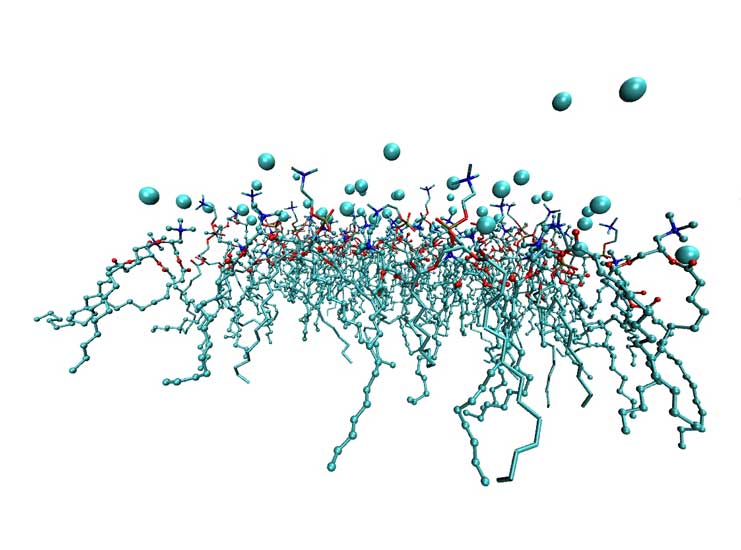 |
A snapshot of a monolayer of a DMPC/DMTAP membrane with molar fraction of cationic DMTAP lipids equal to 0.75 . Lipids are shown in bond representations and chloride counter-ions are shown as spheres. |
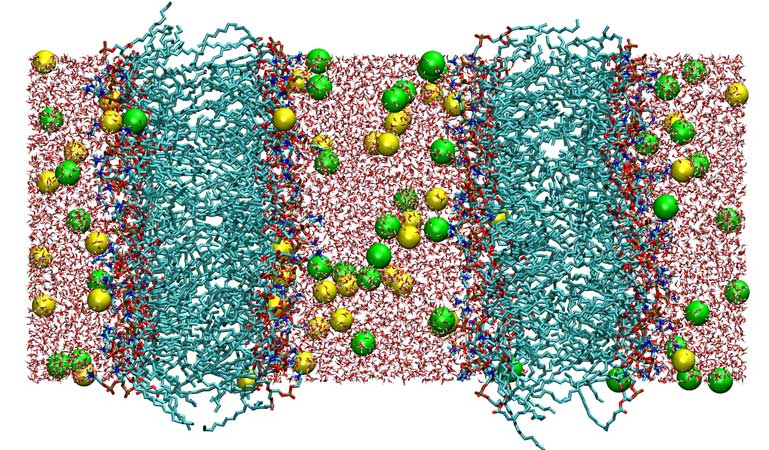 |
Initial structure of a double DMPC bilayer system with a charge imbalance of 6 sodium ions per bilayer, the sodium ion concentration being larger in the “inner” water bath between two bilayers. Lipids are shown in cyan, water in red, sodium ions in yellow, and chloride ions in green. |
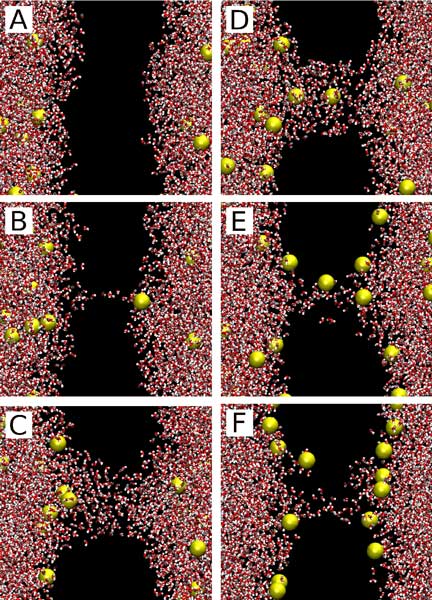 |
Pore formation coupled to ion transport induced by ion imbalance: (A) 20 ps, (B) 450 ps, (C) 1000 ps, (D) 1070 ps, (E) 9180 ps, and (F) 60 ns. The membrane is not shown (black space); water is shown in red-white, and Na ions are in yellow, with excess Na on the left hand side.
|
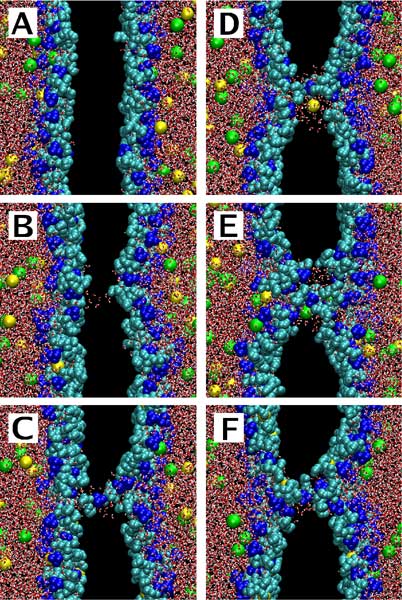 |
Pore formation and pore-mediated ion transport induced by a transmembrane imbalance of sodium ions: (A) 0 ps, (B) 1420 ps, (C) 1490 ps, (D) 1710 ps, (E) 2090 ps, and (F) 10 ns. Water is shown in red-white, choline groups of lipid head groups in blue, phosphate and glycerol groups in cyan, Na ions in yellow, and Cl ions in green. Non-polar acyl chains of lipids are not shown. Excess of Na ions is on the left-hand side. |
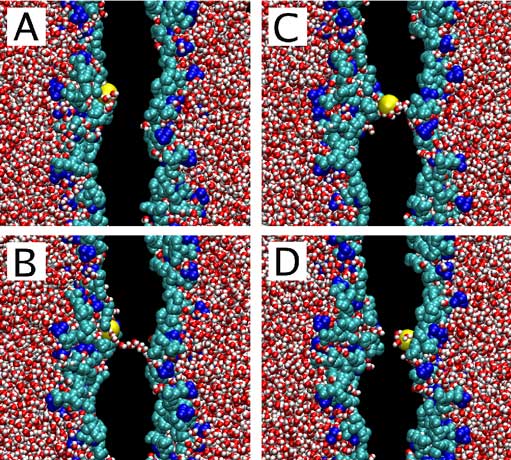 |
‘‘Water-defect-mediated’’ permeation of a potassium ion through the membrane induced by a transmembrane imbalance of cations: (A) 1926 ps, (B) 1944 ps, (C) 1960 ps, (D) 1966 ps. Water is shown in red-white, choline groups of lipid headgroups in blue, phosphate and glycerol groups in cyan, and the leaked potassium ion in yellow; acyl chains of lipids and the rest of ions are not shown. Excess of K ions is on the left-hand side. |